HVR
Translating complex data management into an interactive platform
HVR provides powerful software that helps companies manage their data by updating databases and moving data between them fast and efficiently. Their old interface did not represent the power behind HVR in visualizing the magnitude of data being transferred and managed. It also did not visualize the underlying HVR structure well, making it hard for users to build their own database models.
GOAL
Visualize the magnitude of data being transferred and being able to interact with the underlying data structure.
OUTCOME
An information-dense but easy-to-grap database management tool that allow for exploration, provides insights and aids database modelling.
MY ROLE
UX design, Concept design, User research, Data-design, Co-creation
COMPANY
CLEVER°FRANKE
The project
HVR is a data management company that helps their client’s databases stay up-to-date and keeps their data save. In this project, we re-designed two separate aspects of the service: a visualization of the magnitude of data and a console to set-up and manage the database structure. In two separate design processes, we created an iterative design process by co-creating with the client on a regular basis.
In both processes, I was the main UX designer, but I worked very closely together with a UX consultant and two different visual designers. Together we explored the business and product of HVR in detail, including a 2-day crash course into the software. We also talked to users of the system, to get an understanding of their point-of-view. This helped us gain insights into the complexity and functionalities – and restrictions – of the system.
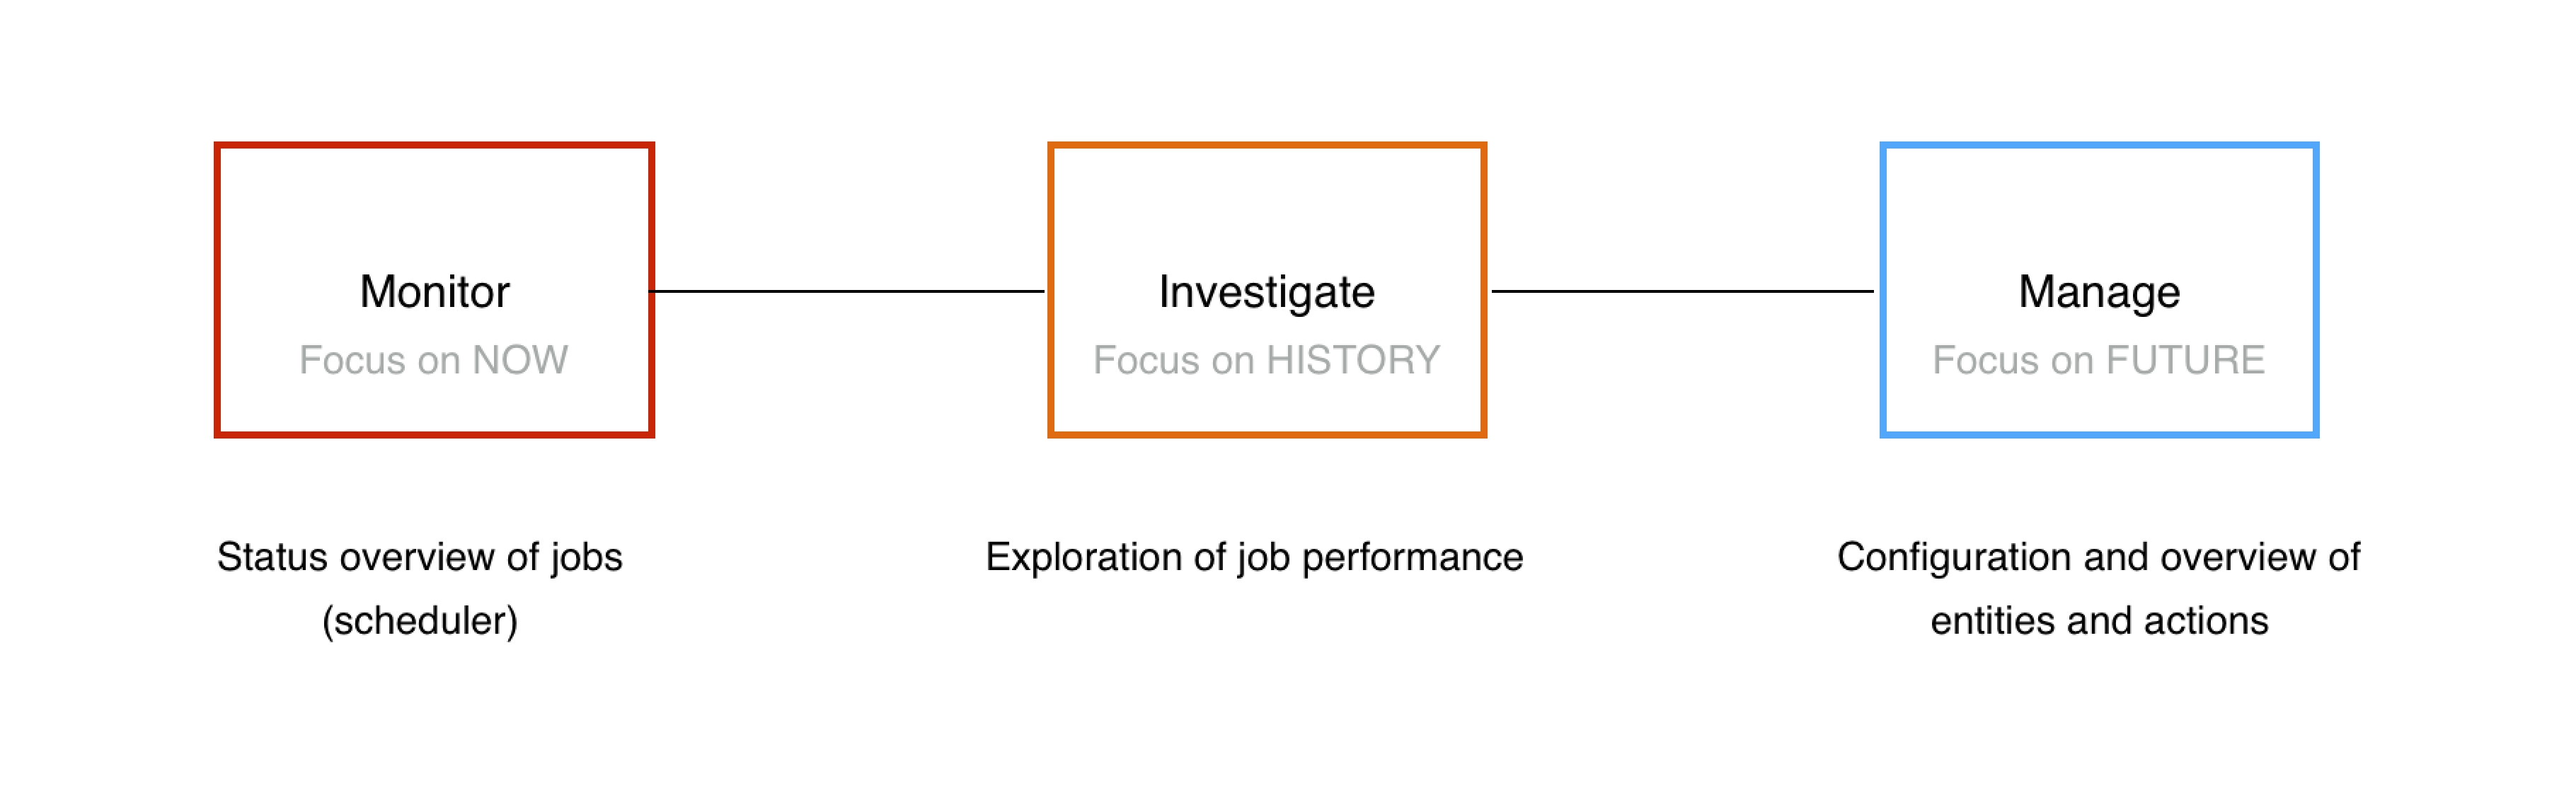
Design process
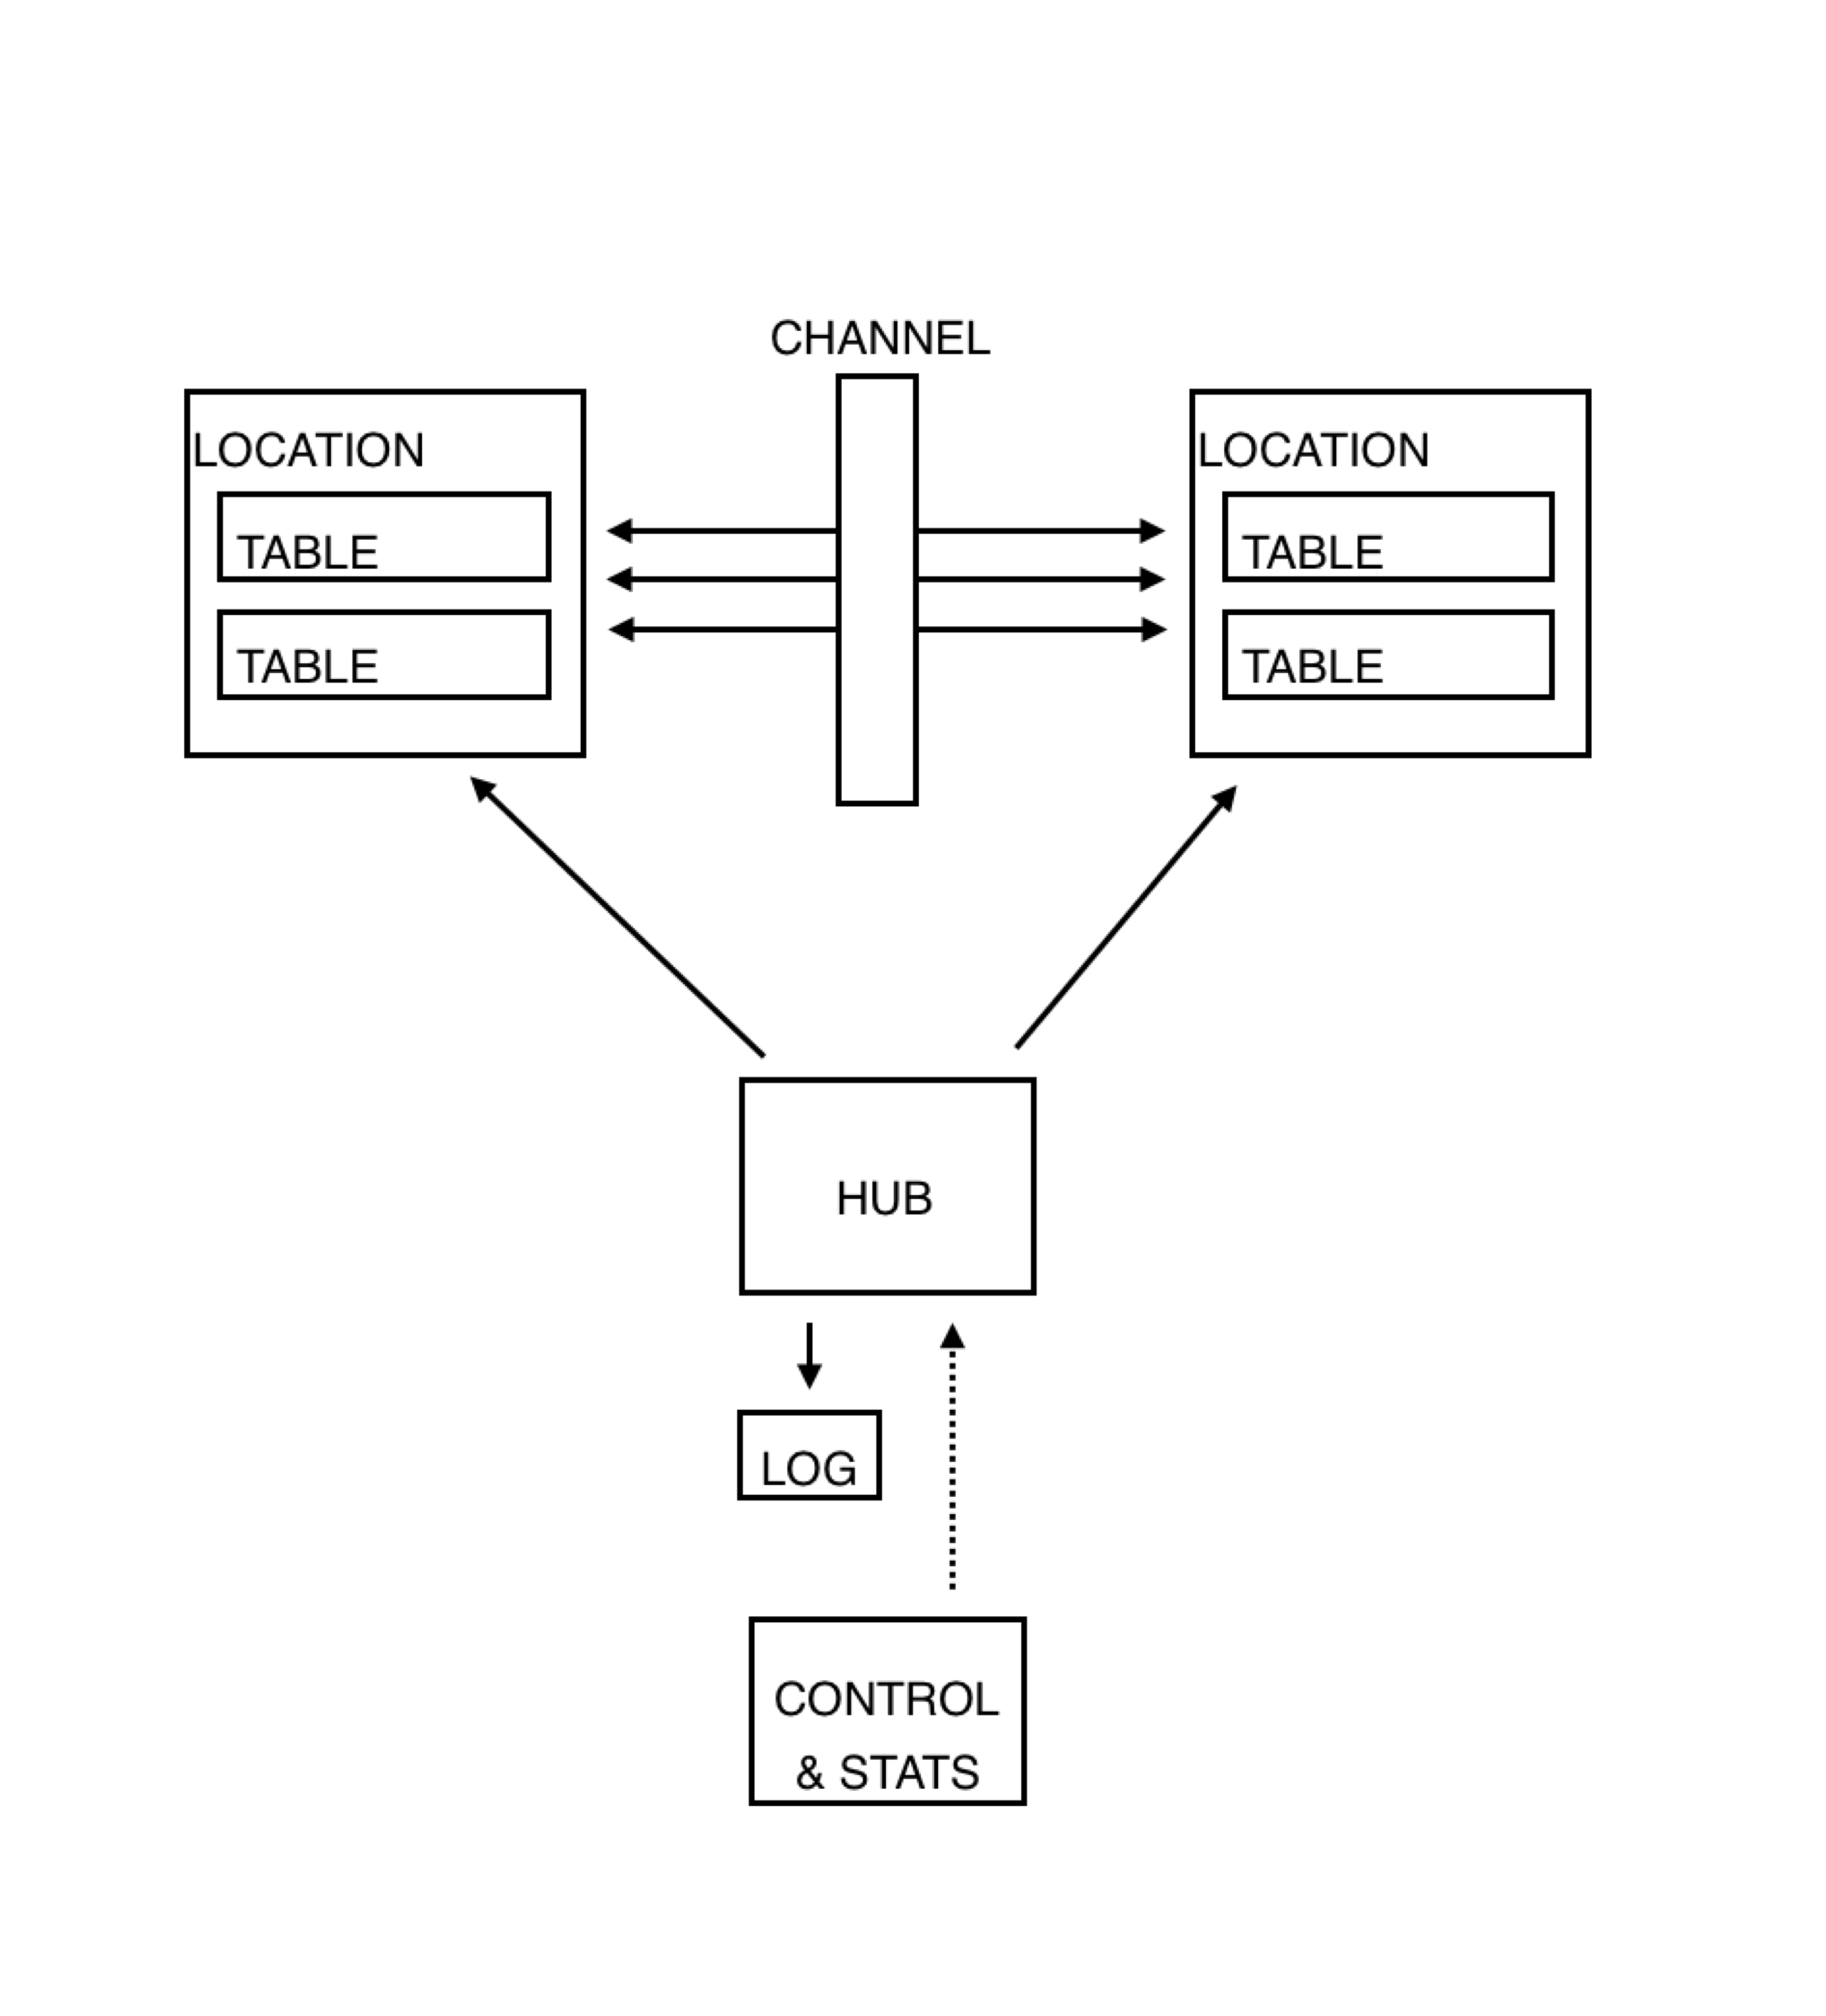
A large part of the process consisted out of understanding and visualizing the inner workings of the system. I dove into the process of data transferring and databases, and created many system visualizations and mappings.
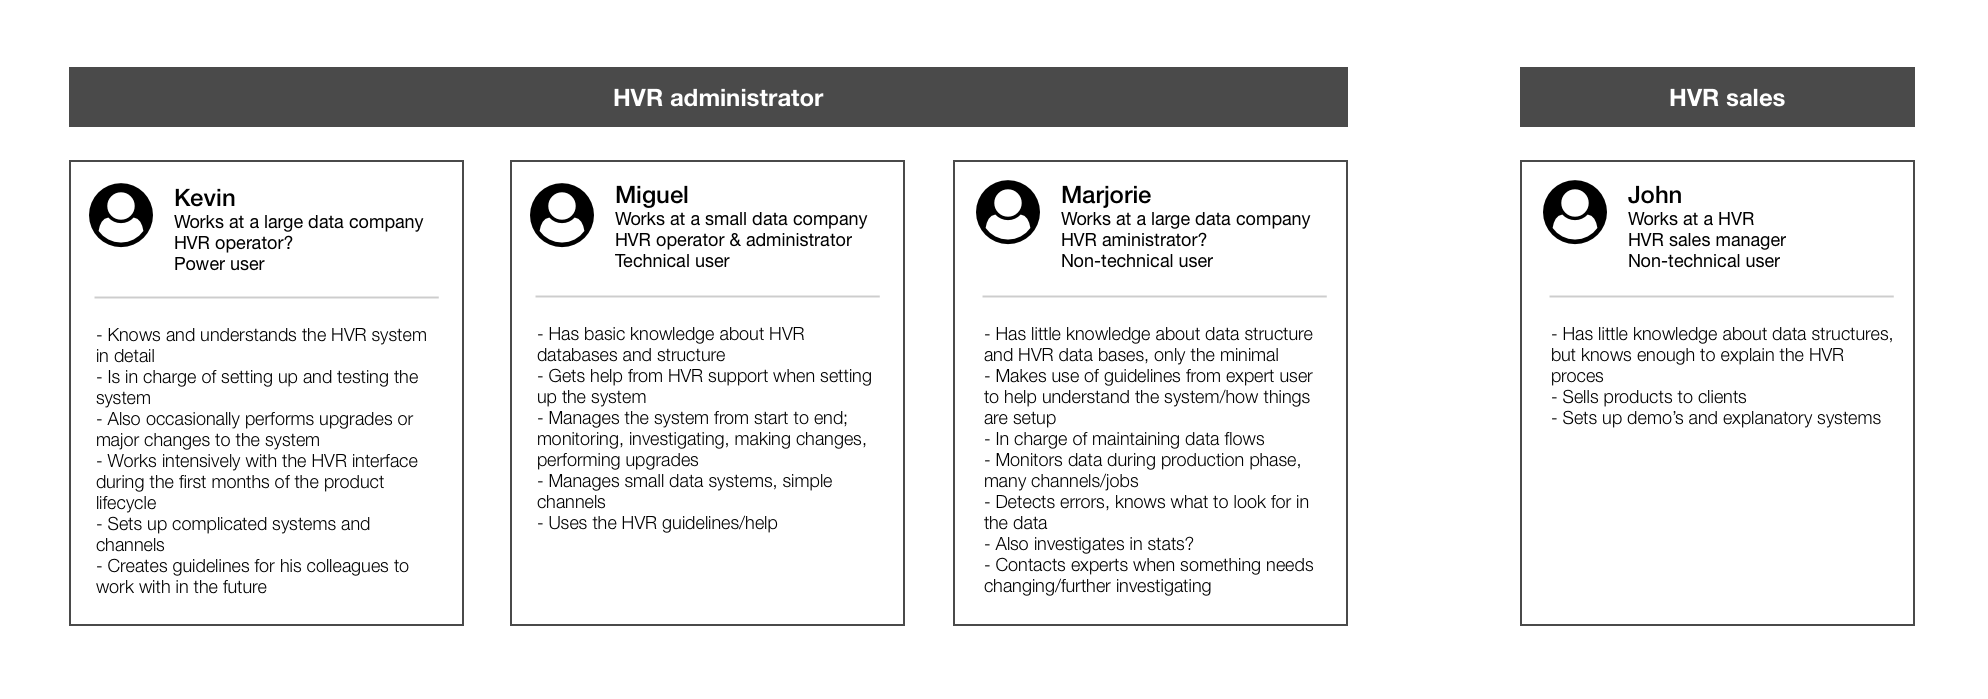
I also specified the main types of users for the system, each with his specific requirements.
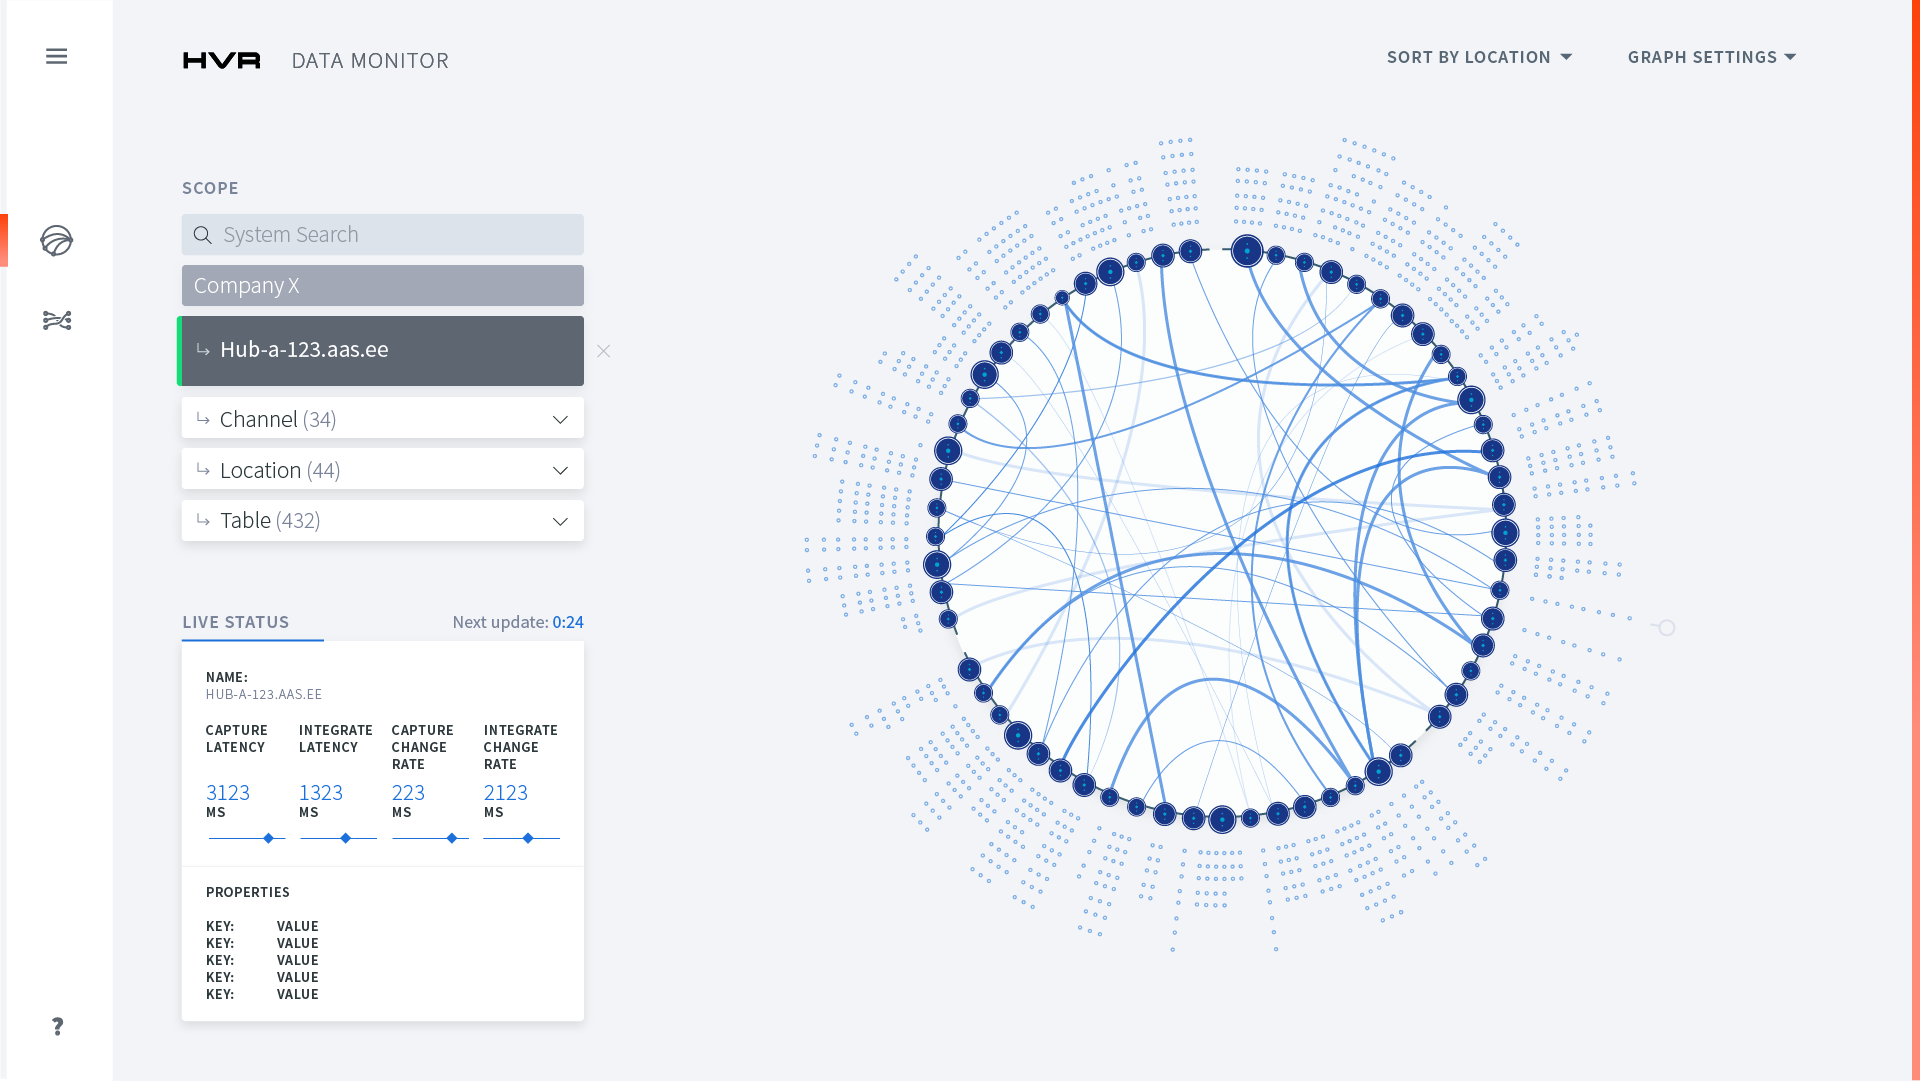
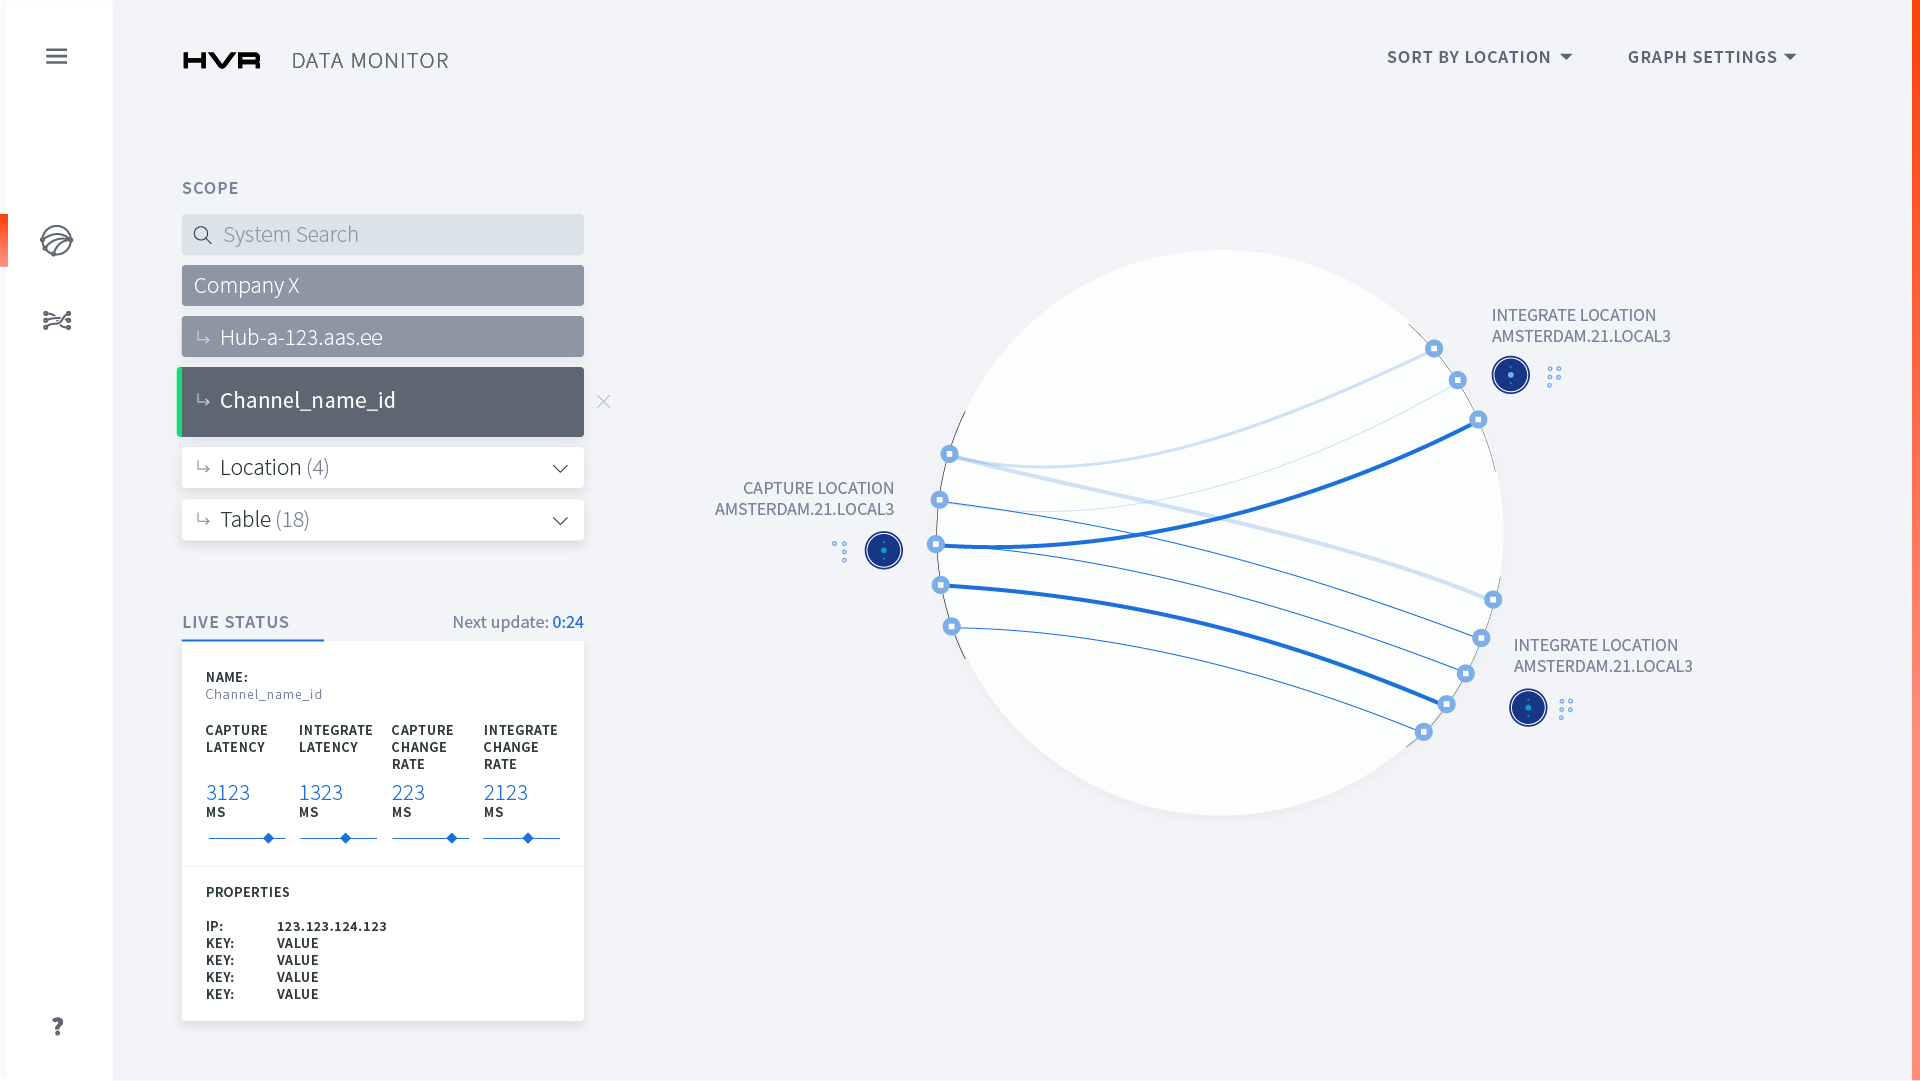
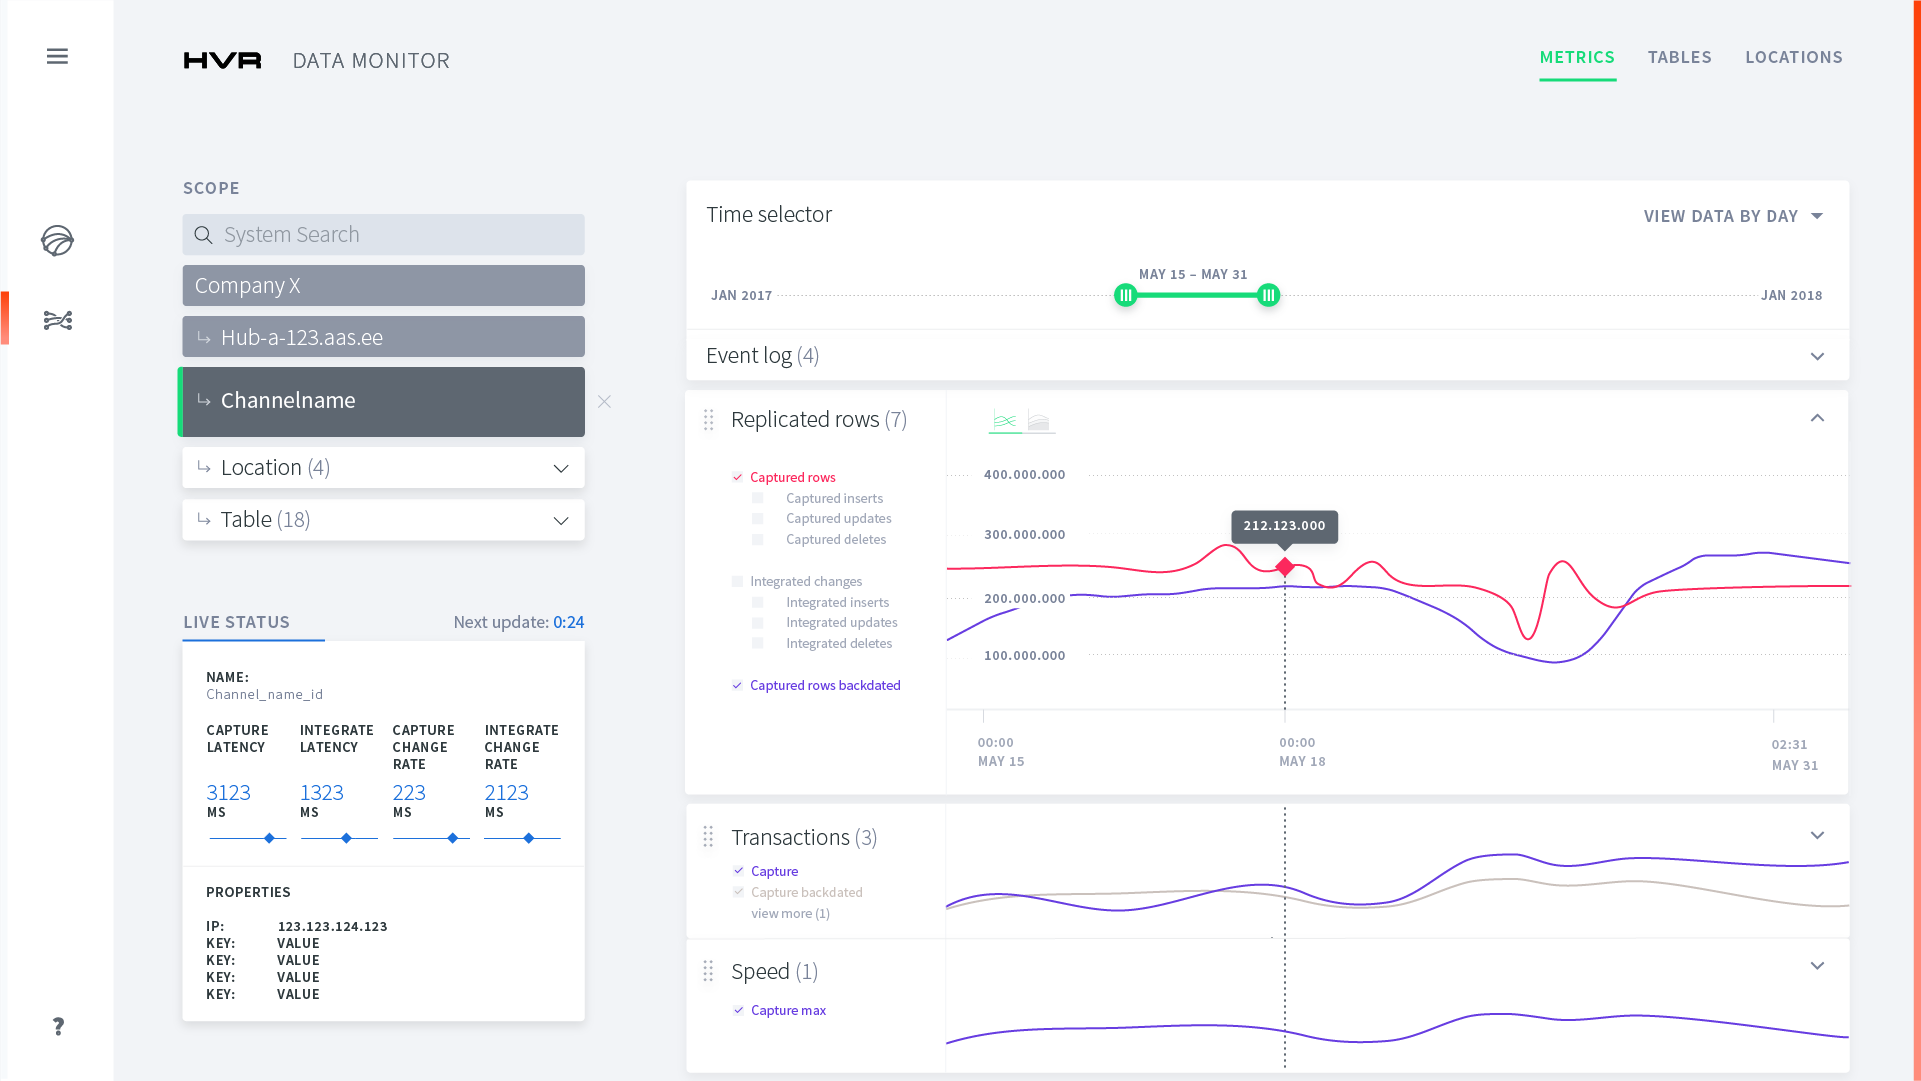
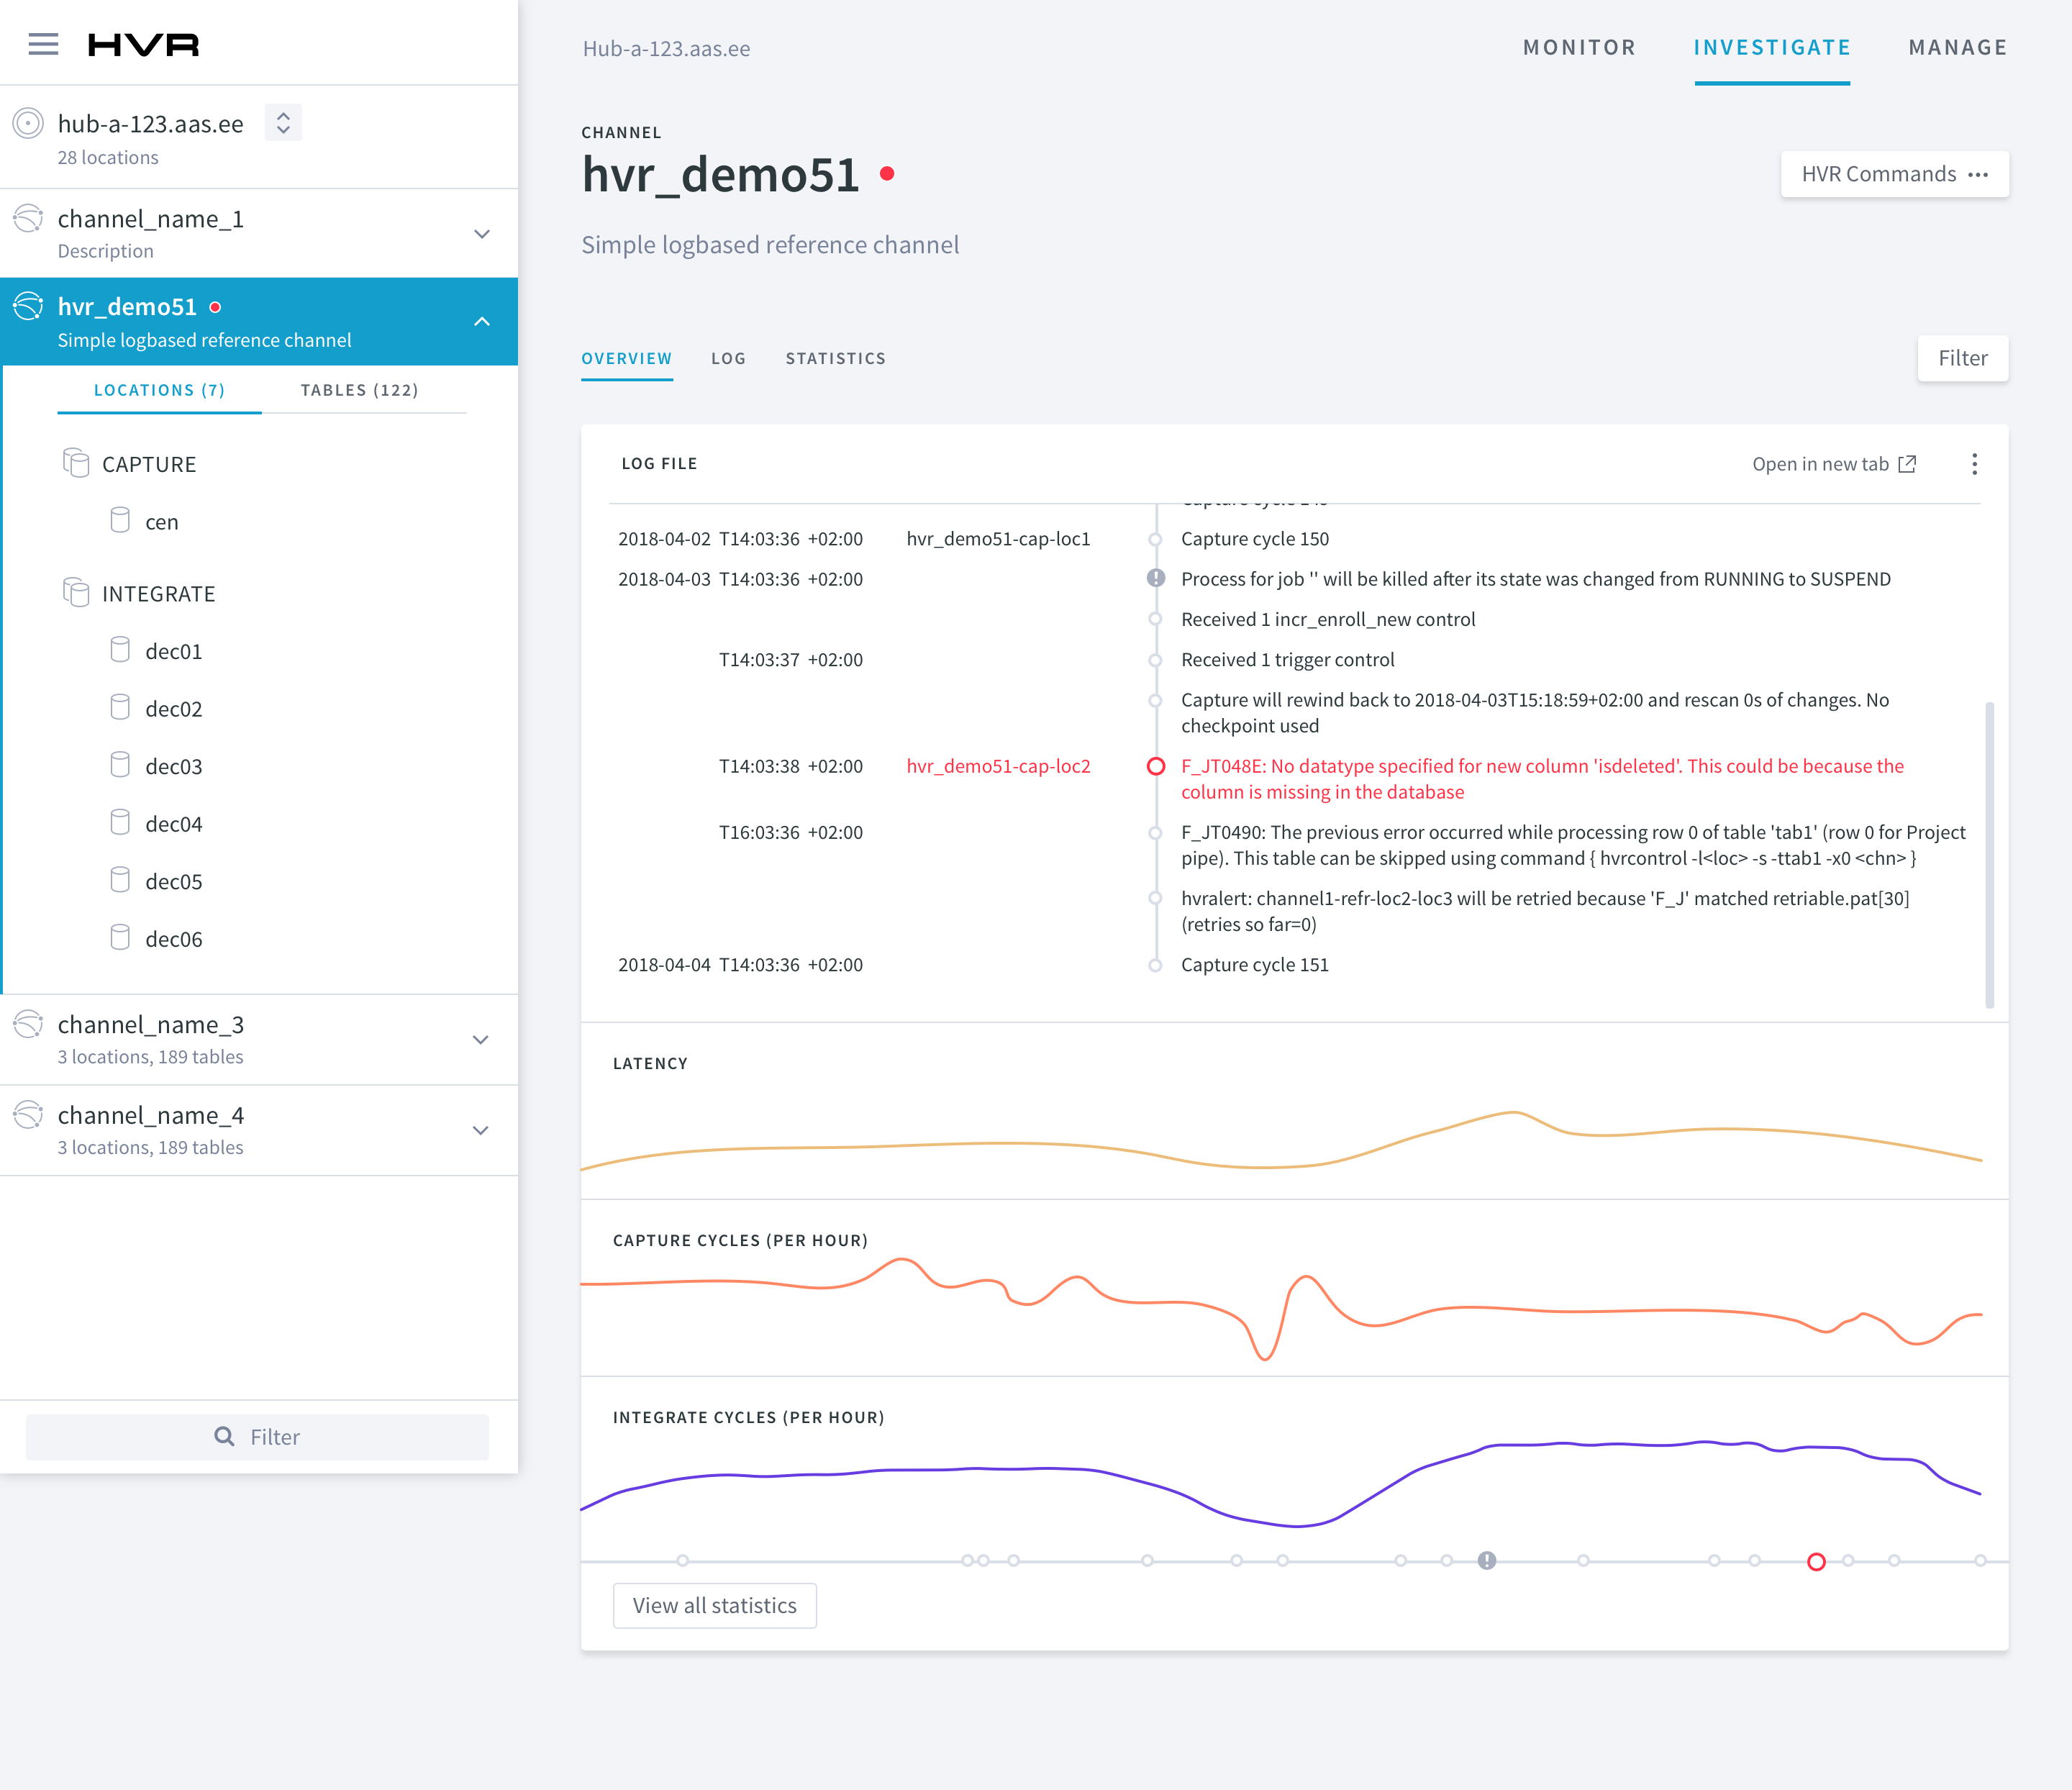
Data monitor
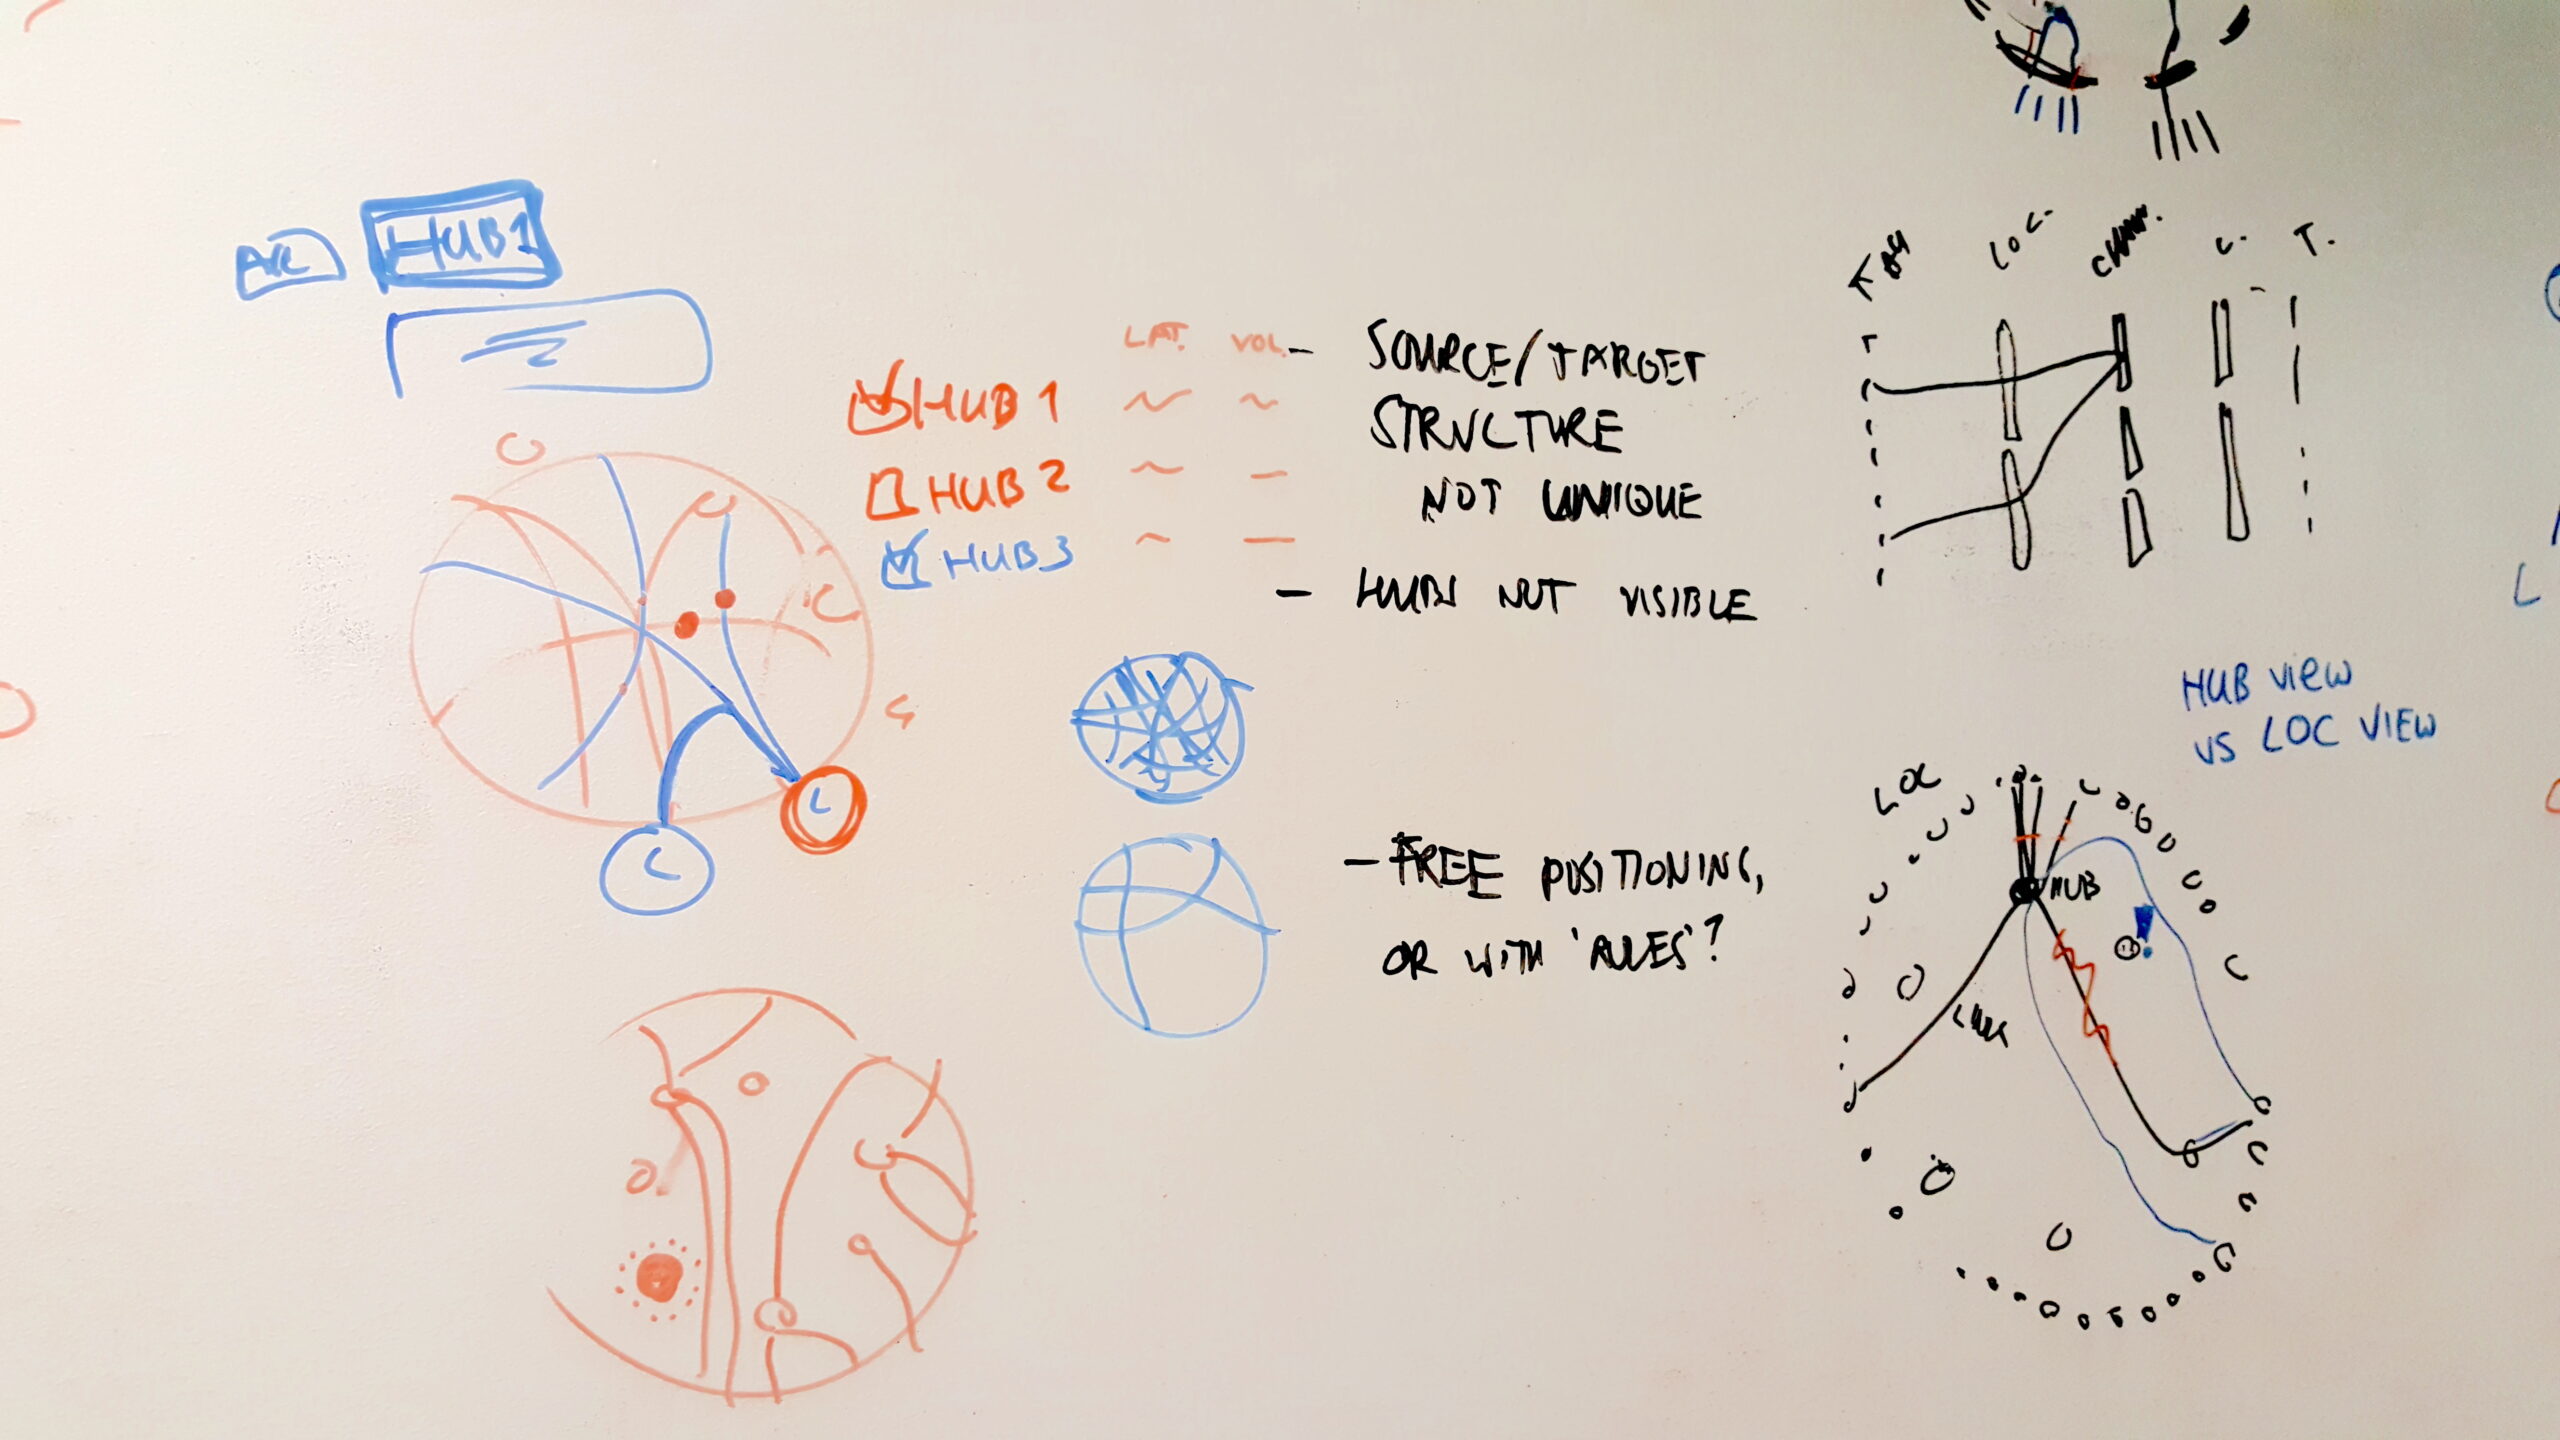
The monitor visualizes how data flows within the system and visualizes the underlying structure of the system. For this project, I worked closely together with the UX consultant and visual designer to brainstorm various possible visualizations for such data streams. I also designed the overall structure for this part of the system, taking into account various ways of viewing the same data.
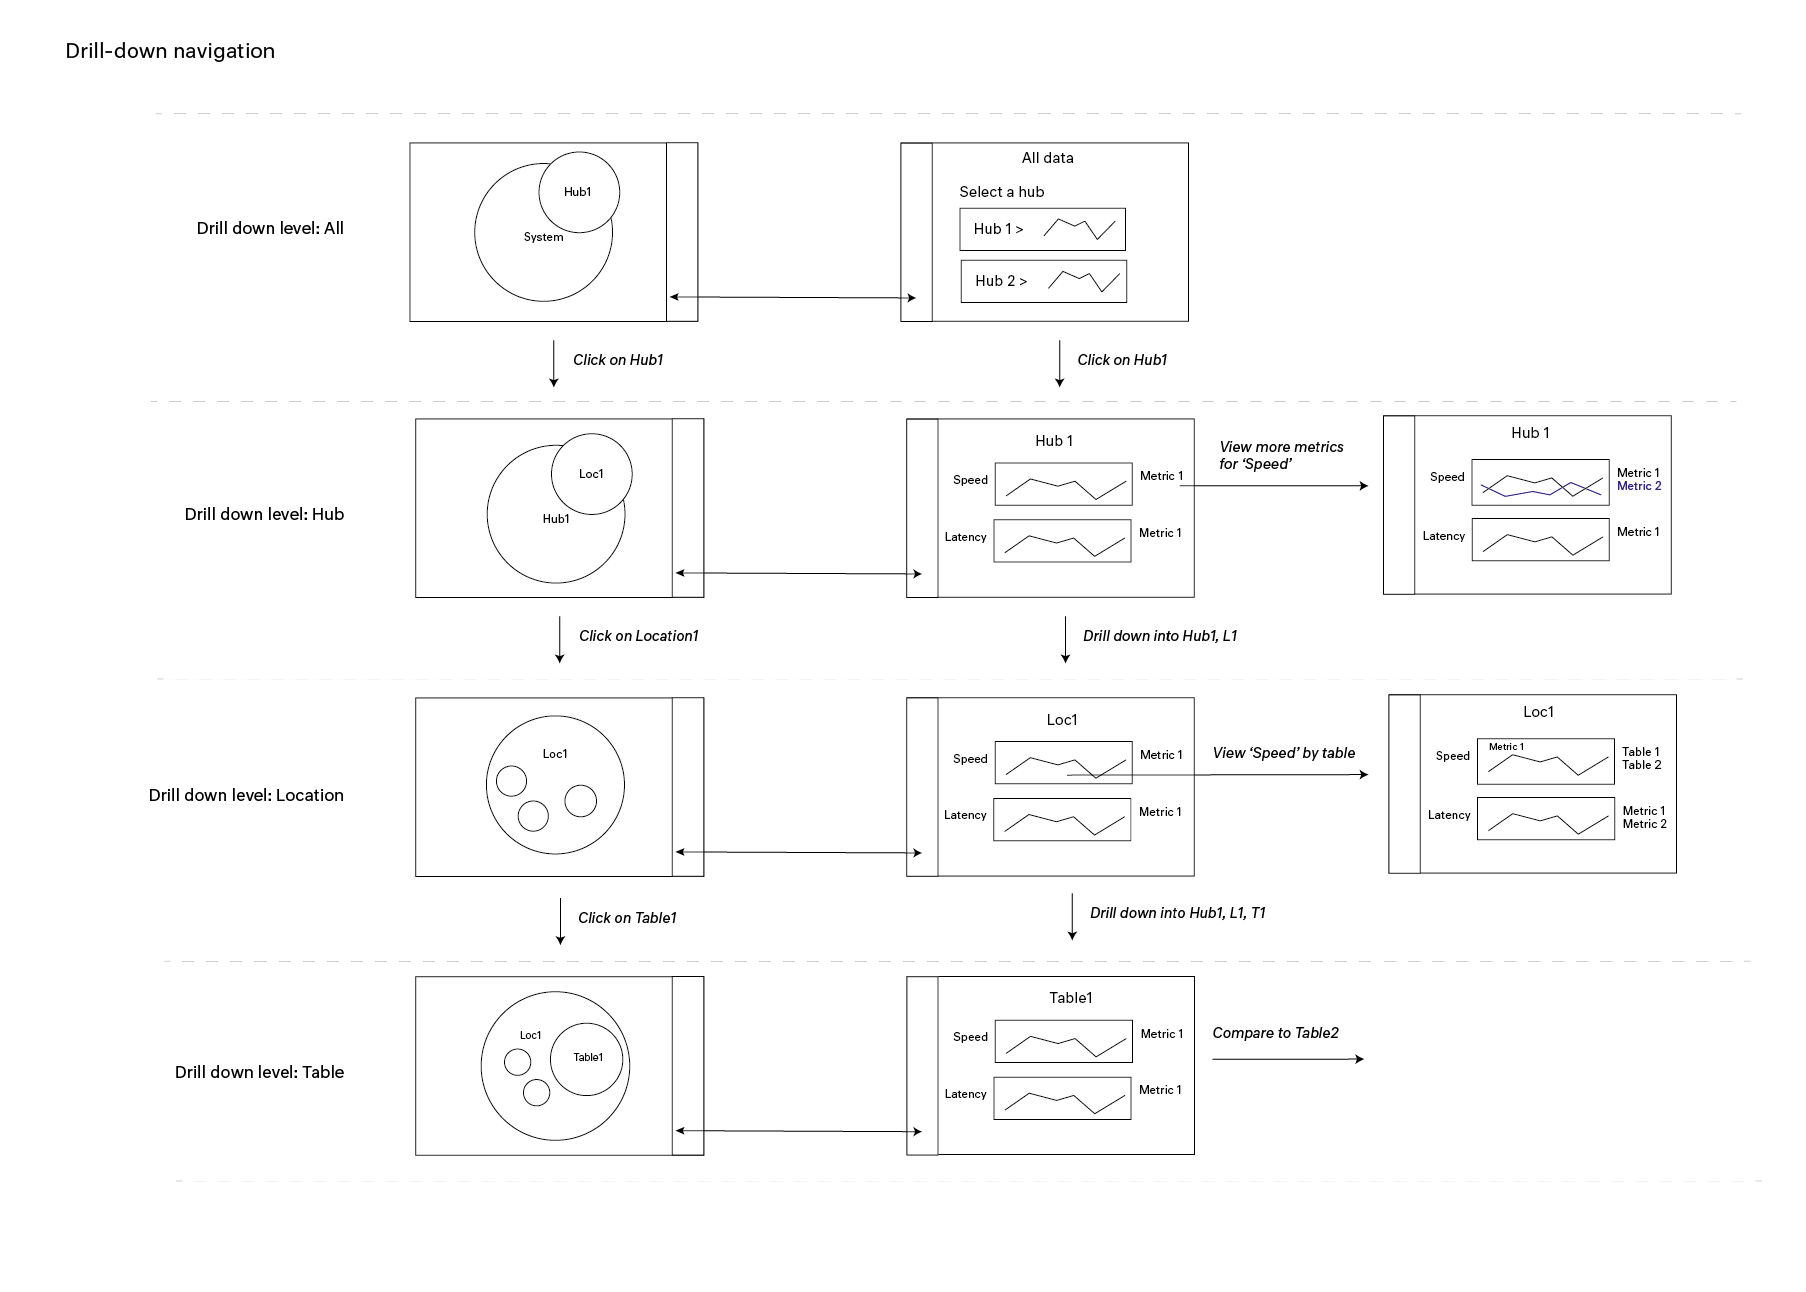
Together with the visual designer I elaborated on the sketches and he translated the wireframes into a visual concept. The final data visualization was an information-dense, adaptive and appealing product that allows for easy exploration of the data. It also visualizes the scale and power of the HVR software.
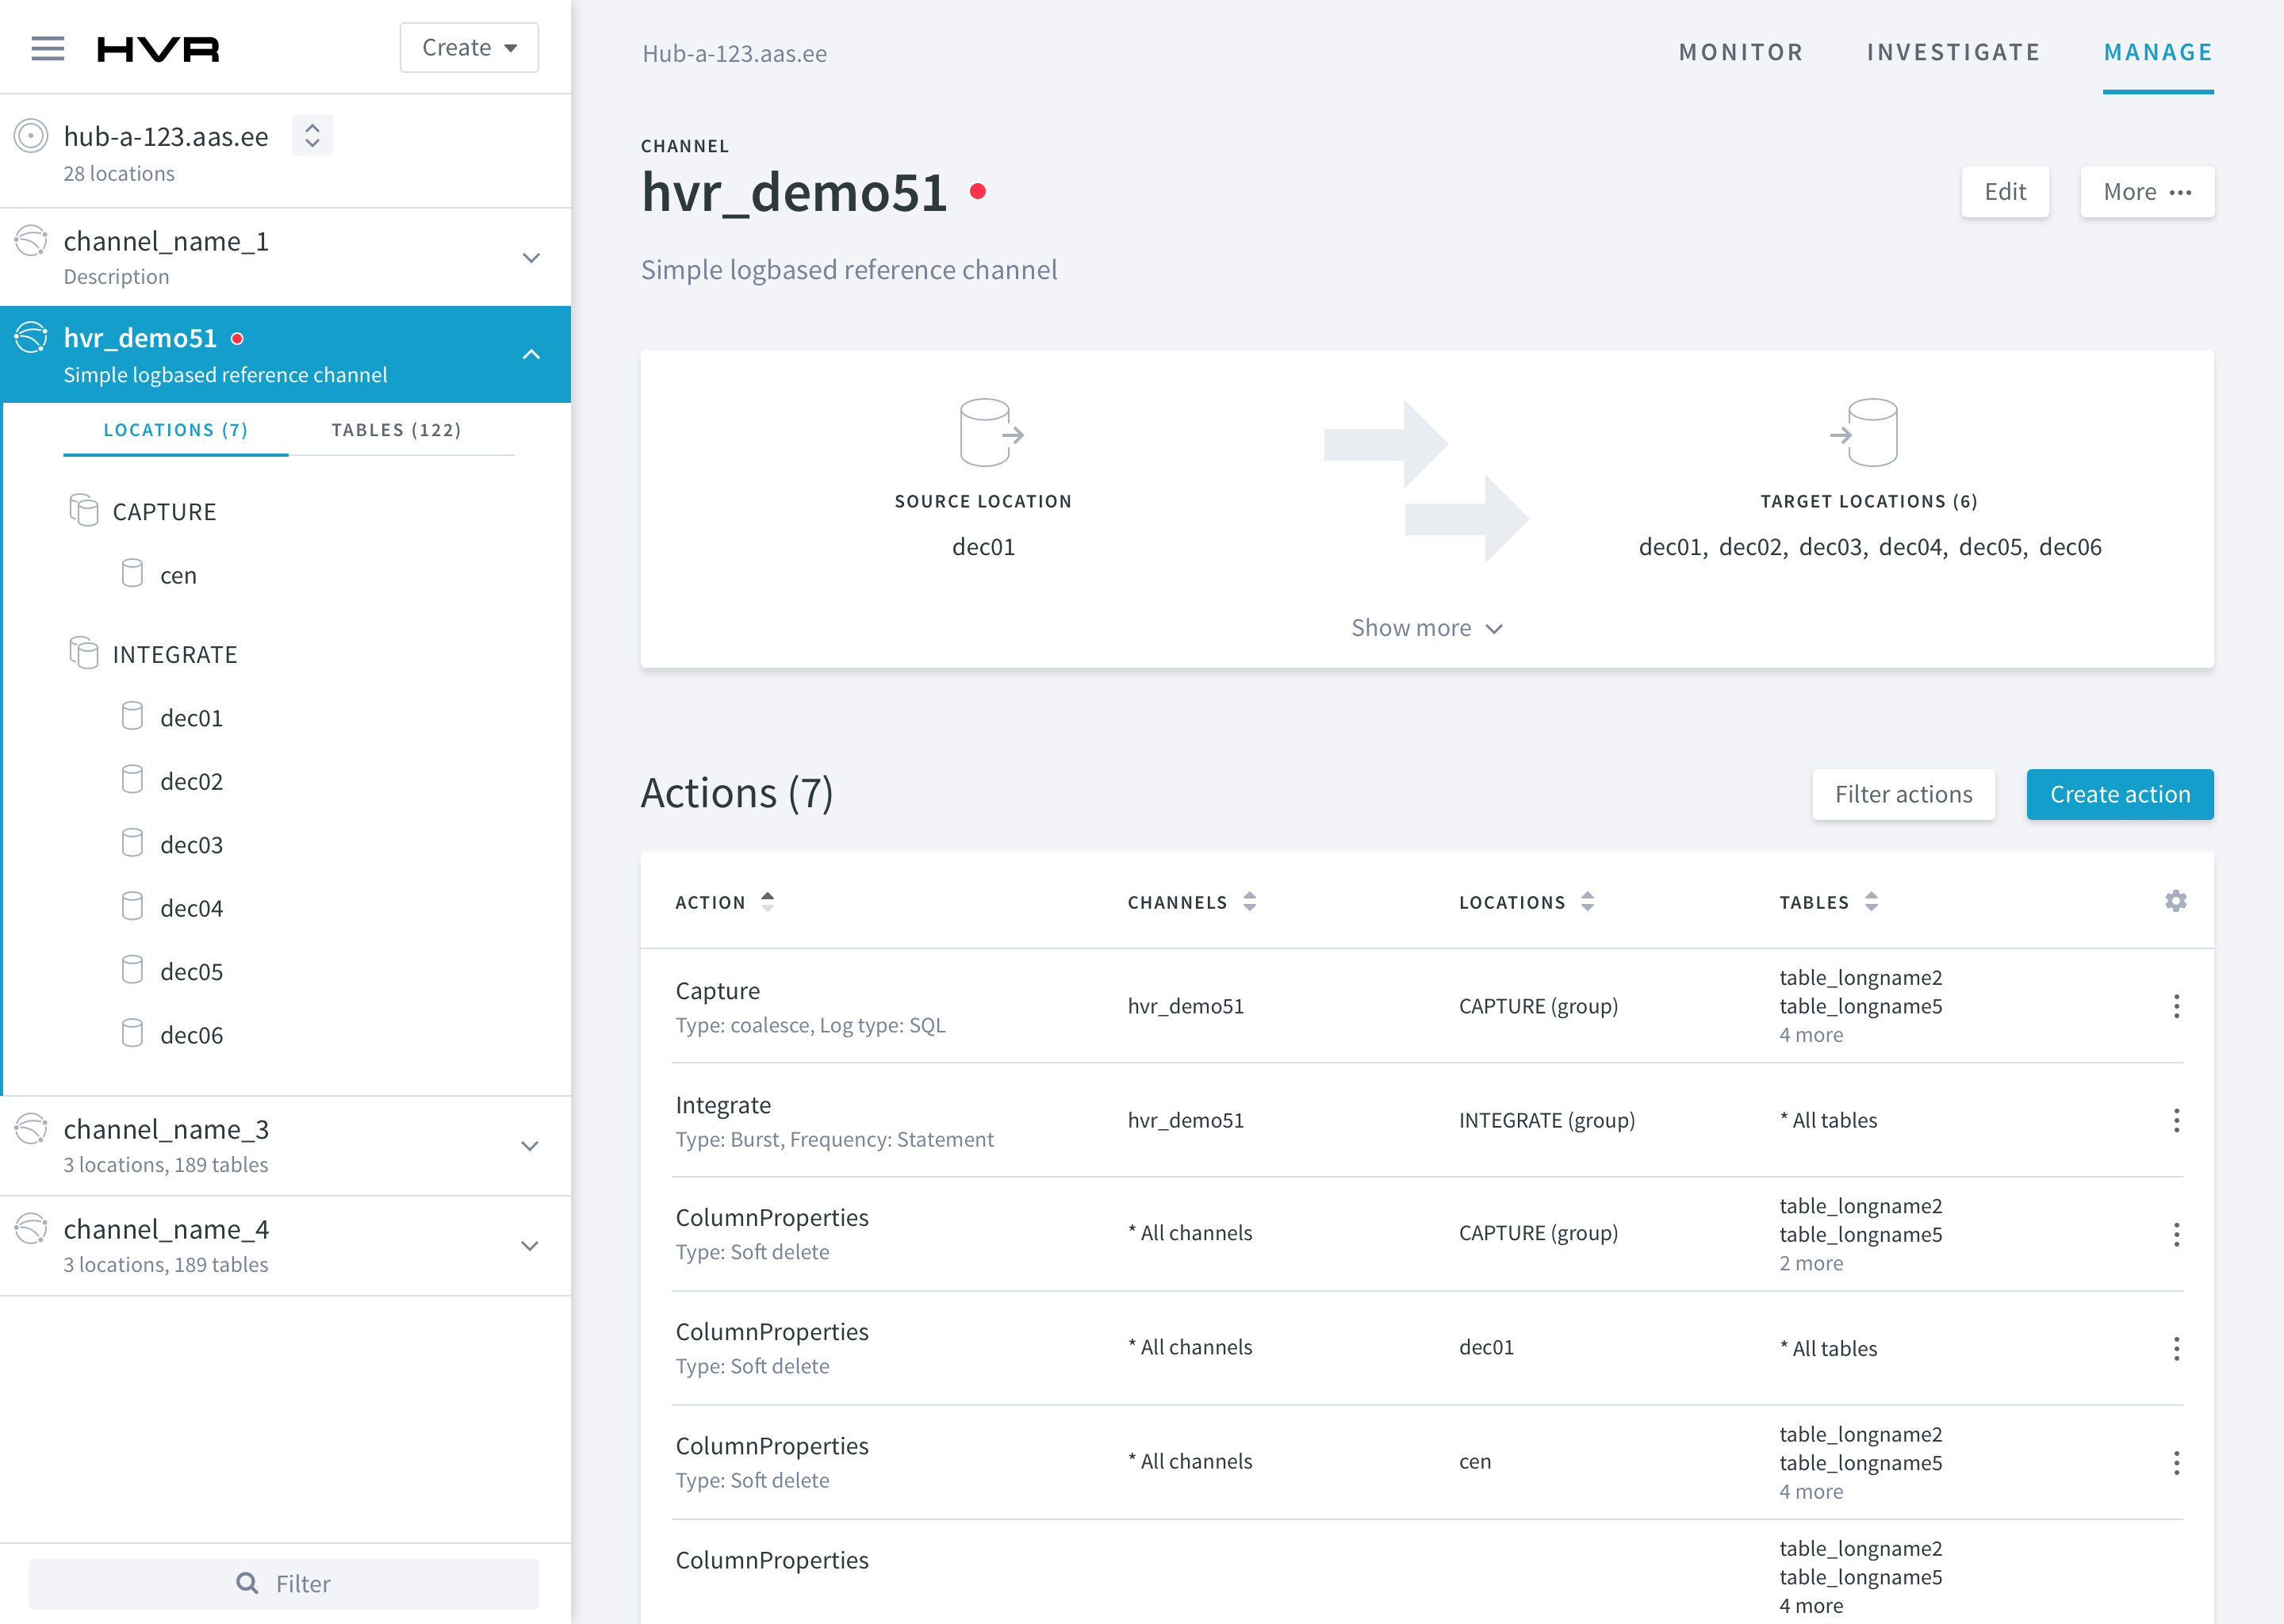
Data console
The console is the interface with which users work to set up and manage existing data flows. Together with the visual designer, I analyzed the existing HVR software and interface. We also interviewed various users of the current system to better identify their goals and tasks within the interface. We determined three main user tasks and instead of simply improving interactions, we proposed a new system design build around the main functionalities.
Throughout the process, we had various interactive sessions with HVR in which we discussed and co-created different design directions for the interface. This helped make sure our assumptions and designs were in line with all of HVR’s functionalities.
As the lead interaction designer, I mapped out the system structure, designed the various user flows and created sketches and wireframes of a variety of pages and interactions within the main flow. The visual designer created the visual style to aid the ease-of-use of the complex system.
The new HVR console offers users a clear overview of main functionalities and a fast path to their goal. It offers relevant information at the right time, in-context interactions and explanation of the HVR constructs.
My activities
- Conceptualizing & detailing the system structure
- Co-creating with the client
- Designing data visualization principles
- Designing user experience & interactions of both systems
- Usertesting & interviewing current HVR users